It has been a while since we last updated our utility escalation study, and the shift is hard to ignore. Electricity rates are no longer moving in line with previous modeling assumptions. They are through the roof (more on rooftops below…).
According to new data from the U.S. Energy Information Administration, national commercial electricity prices increased nearly 8% year over year from December 2024 to December 2025. Arcadia’s first annual Commercial Electricity Rate Report found a median compound annual growth rate of 5.9% from 2020 through 2025, nearly double the 3% escalator still embedded in many financial models. In practical terms, 6% is the new 3%.
The national averages only tell part of the story. Several key commercial real estate markets are seeing even sharper increases and significant volatility within the same year.
New Jersey (Commercial): 15.4 cents per kWh in Q1 2025 to 18.2 cents in Q3 2025 before settling at 16.1 cents in Q4.¹ That represents nearly an 18% increase from Q1 to Q3 in a matter of months.
Maryland (Commercial): 14.1 cents in Q1 2025 to 15.6 cents in Q4 2025, more than a 10% increase within the same calendar year.¹
In parts of Pennsylvania and the District of Columbia, increases approached or exceeded 20%.
These are not minor fluctuations. They represent structural cost pressure in markets where many CRE portfolios are concentrated. Just as importantly, they show that electricity inflation is not linear. It is volatile and increasingly difficult to model with flat assumptions.
For commercial real estate owners and asset managers, escalation is not just an operating expense line item. It directly affects NOI, underwriting assumptions, and long term asset value.
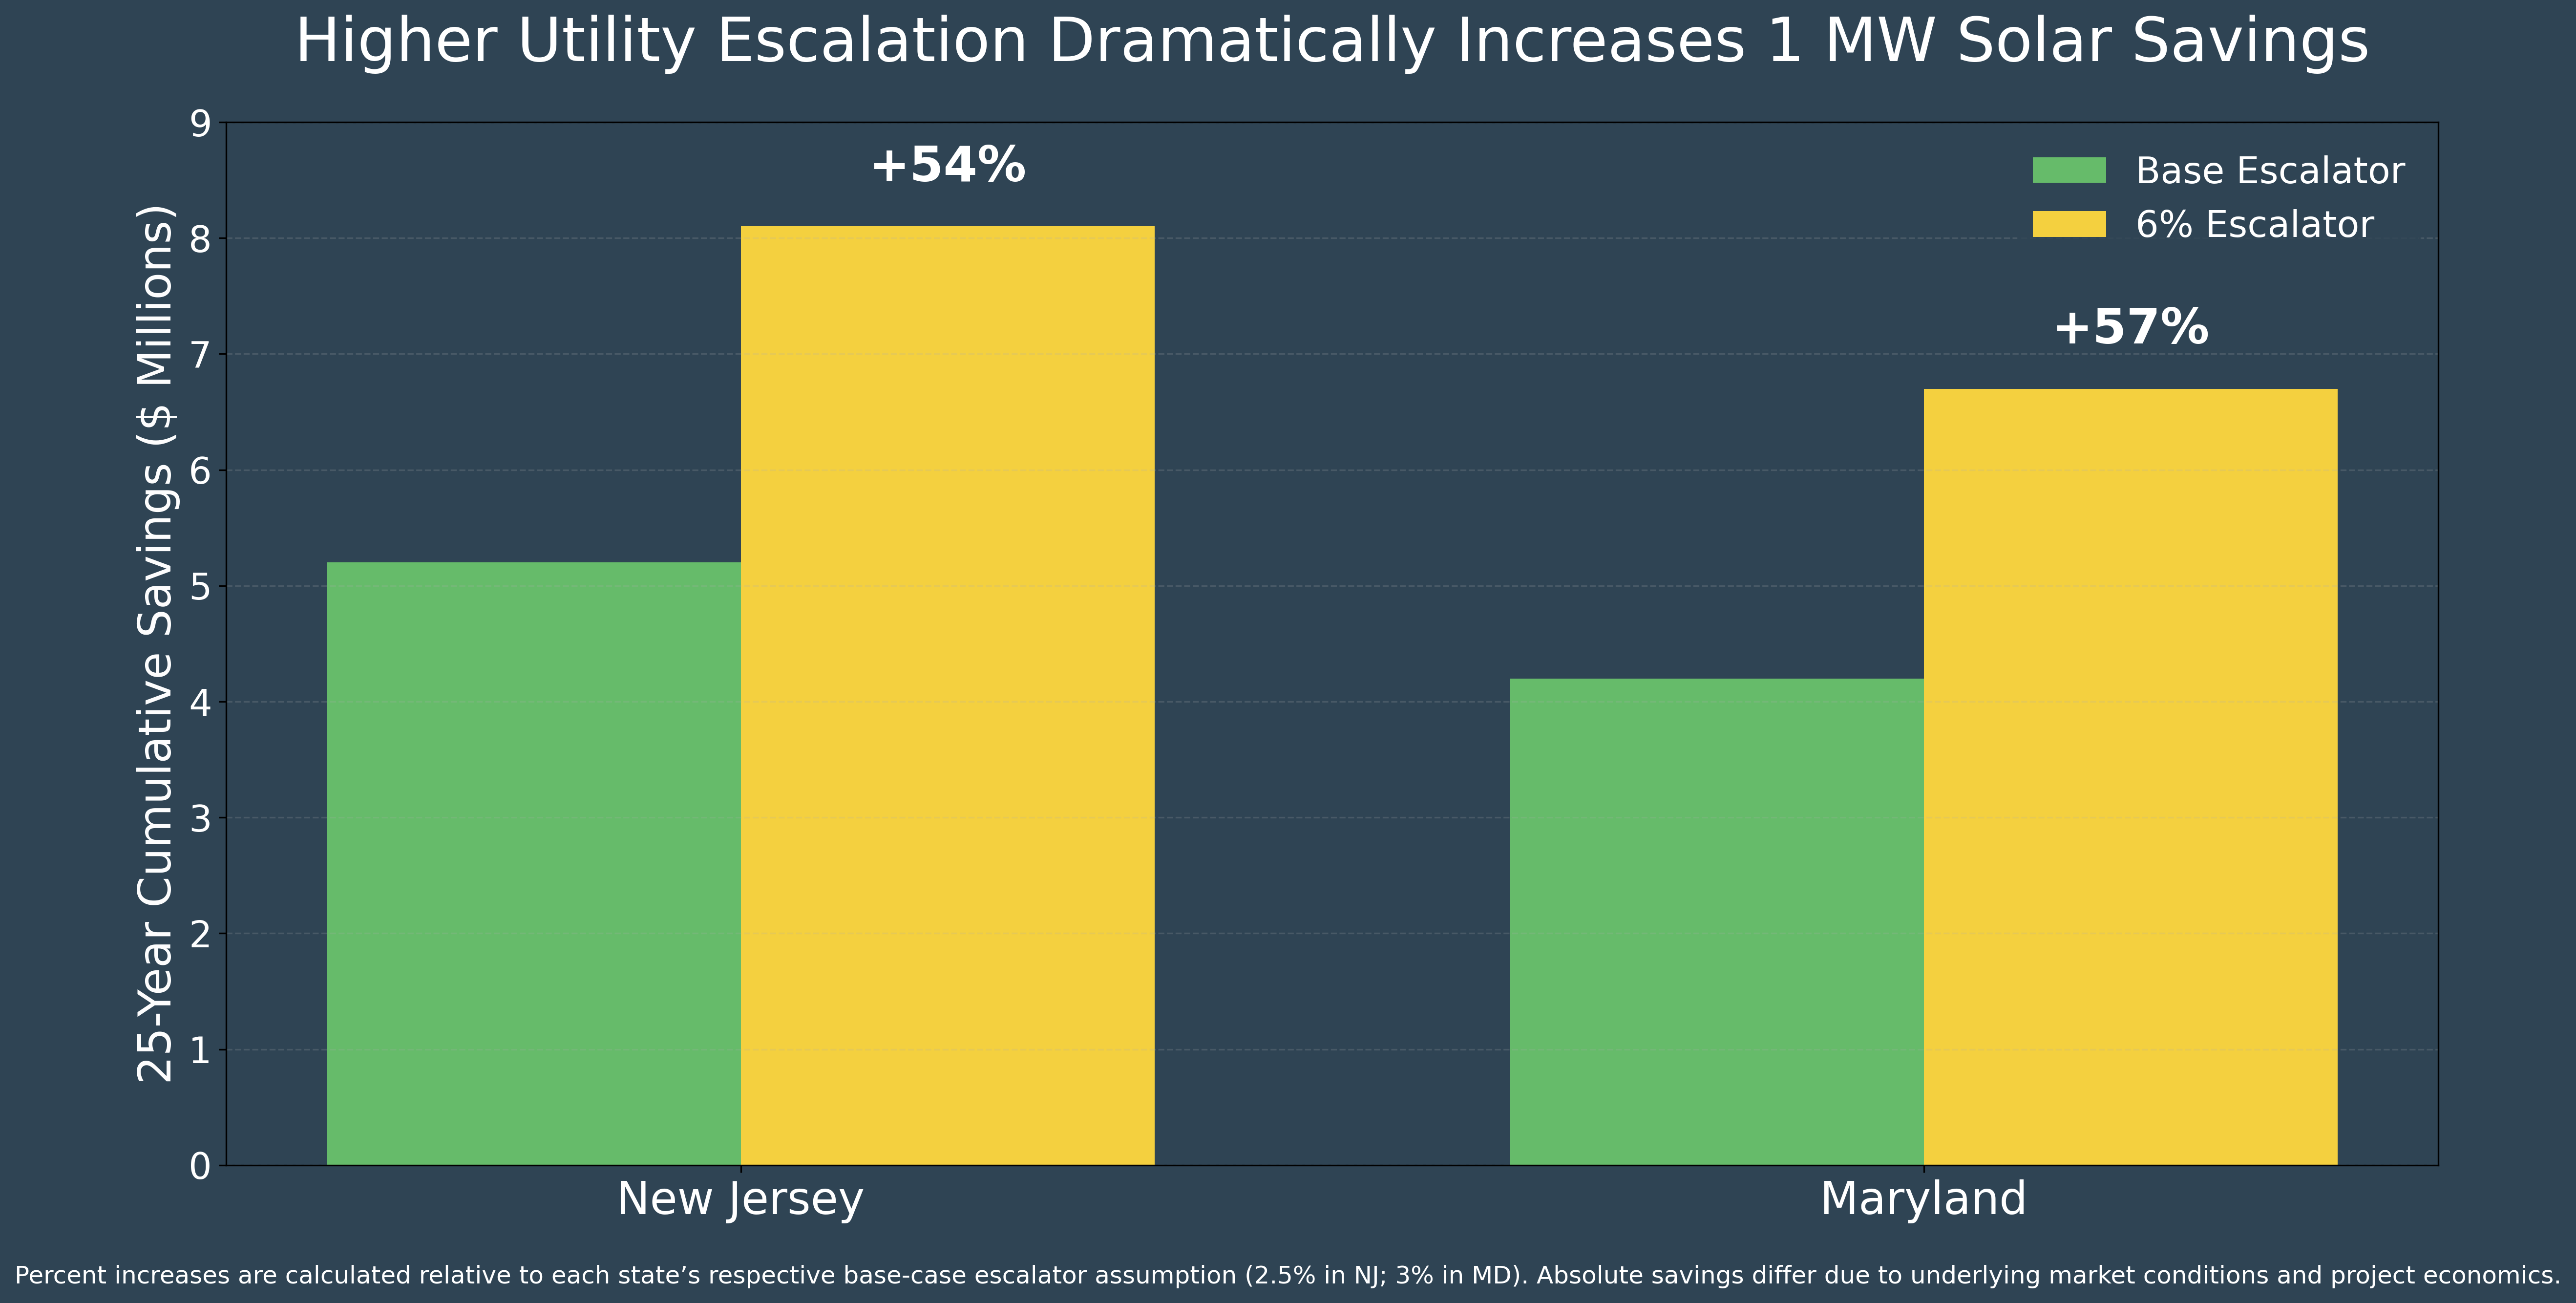
A proforma that assumes 2 to 3% escalation is underestimating future operating costs in today’s environment. Financial models are intentionally conservative, however, modeling with a higher escalation rate, reflective of current market conditions, materially increases projected savings from solar implementation.
In a market where margins are tightening and capital is more selective, electricity escalation is no longer background noise. It is a valuation variable.
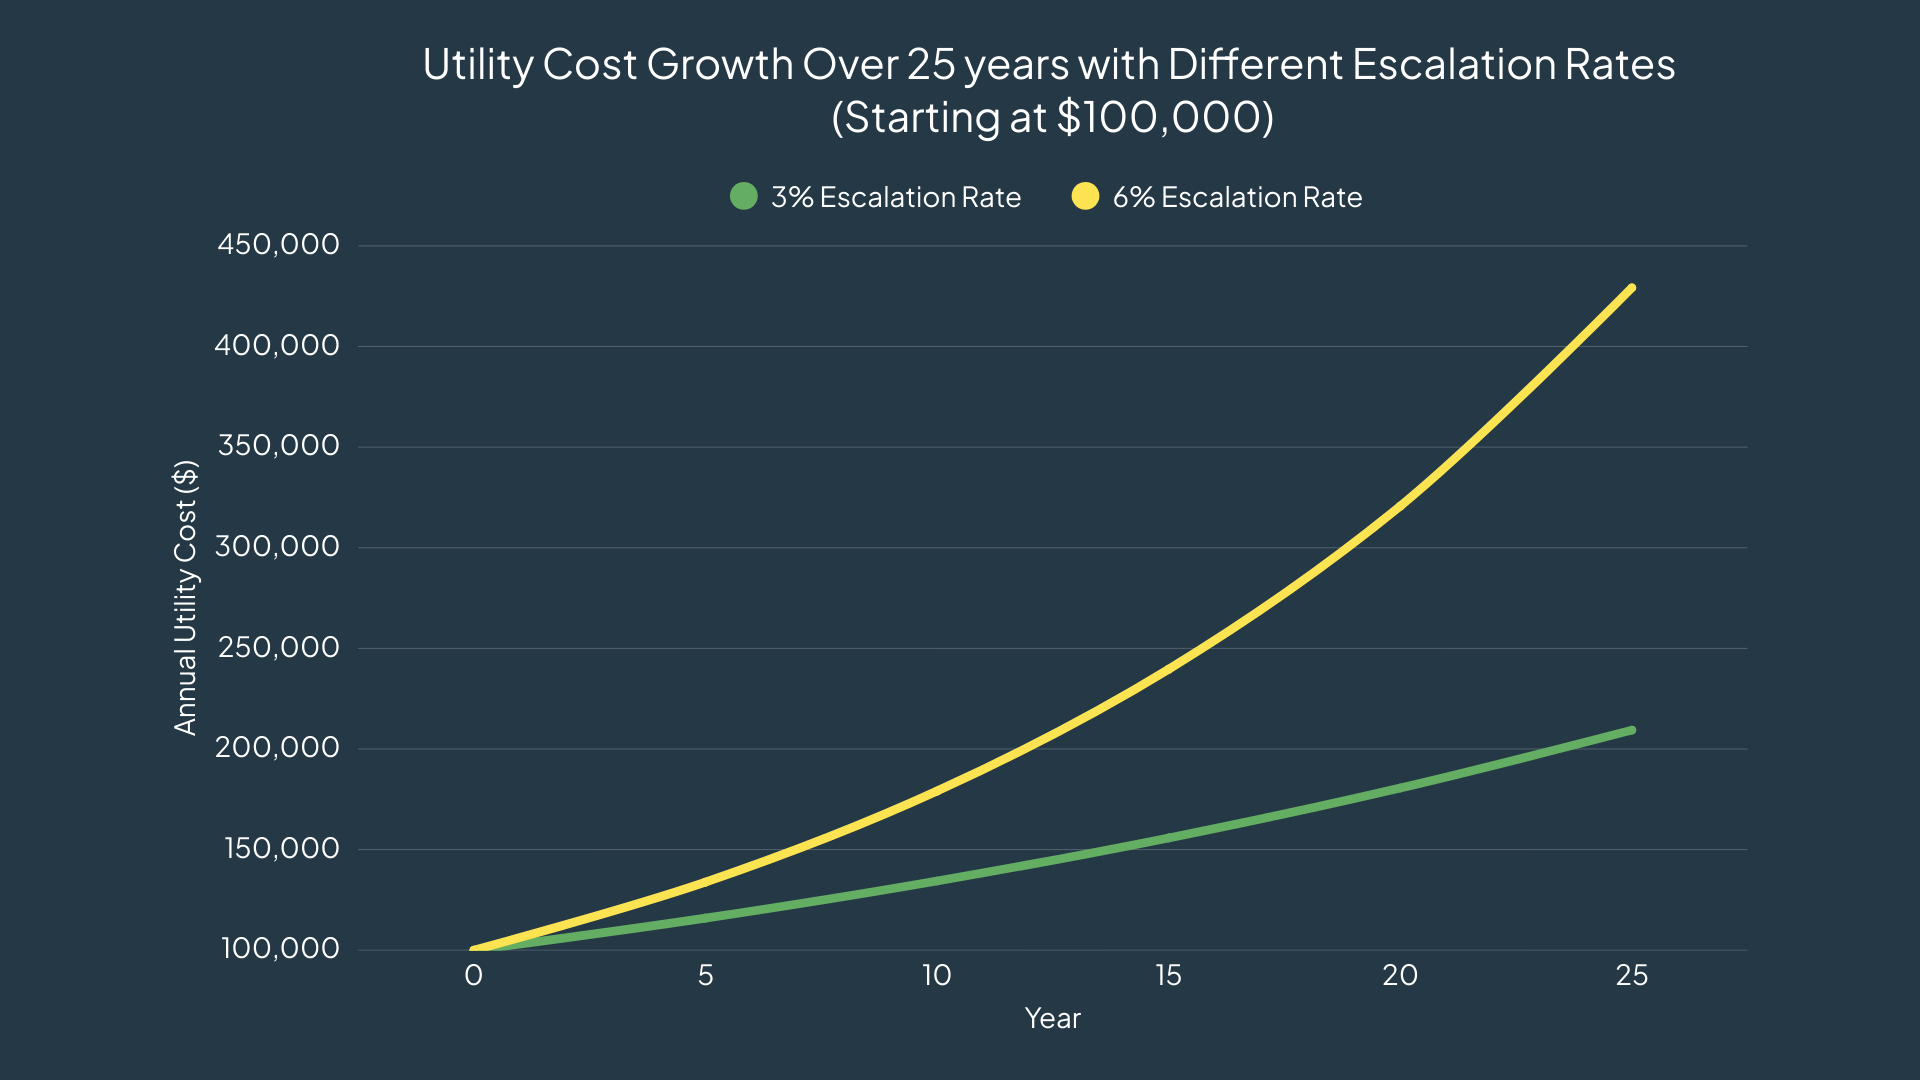
Year 25 annual cost: approximately $203,000. Total 25 year utility spend: approximately $3.65 million
Year 25 annual cost: approximately $429,000 Total 25 year utility spend: approximately $5.48 million
Moving from 3% to 6% results in approximately $1.8 million more in electricity costs over 25 years.
That difference directly impacts NOI and, by extension, asset valuation, and solar becomes a significant lever. See related blog post: Solar as a Hedge Against Rising Energy Costs A seemingly small modeling assumption compounds into a meaningful financial outcome over the life of a property and has a greater impact on cumulative long term savings.
Escalating utility rates are no longer a minor budgeting adjustment. Though financial models are intentionally built on conservative 2 to 3% escalation rates, these estimates are no longer reflective of the true potential savings from installing solar.
Commercial real estate owners and managers should consider how these accelerating utility rates impact their tenants, and how solar can help mitigate rising costs, especially in markets already experiencing double digit increases. The difference in 3% assumptions and the 6% market reality may seem incremental, but over a 20 to 25 year timeframe it can materially change projected returns.
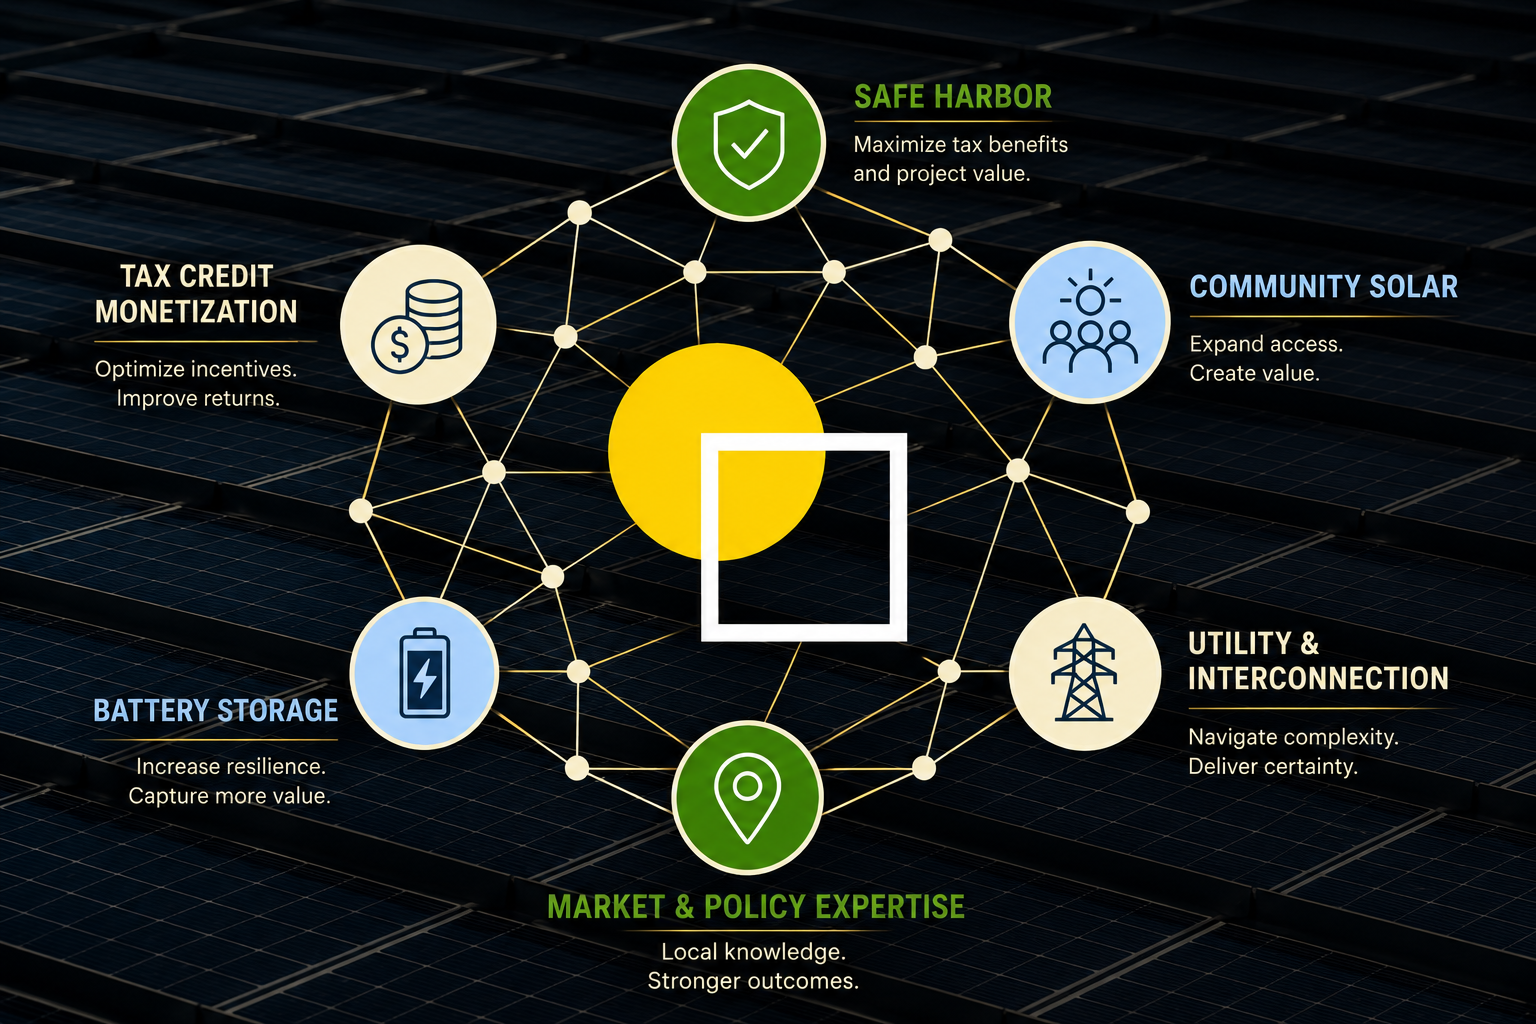
With clear evidence of acceleration in electricity pricing, now is the time to stress test assumptions, model regional exposure, and evaluate long term hedging strategies such as onsite solar and storage. For commercial and industrial property owners, solar provides long-term cost predictability, protection against seasonal capacity spikes, reduced exposure to grid volatility, and improved NOI stability.
SolarKal is here to guide you through this transition, helping future-proof commercial properties against rising and increasingly unpredictable energy expenses. Contact an advisor to reassess your escalation assumptions and evaluate your solar opportunity.
Sources